Tokyo Institute of Technology researchers use fMRI datasets to train a computer to predict the semantic category of an image originally viewed by five different people.
Understanding how the human brain categorizes information through signs and language is a key part of developing computers that can ‘think’ and ‘see’ in the same way as humans. Hiroyuki Akama at the Graduate School of Decision Science and Technology, Tokyo Institute of Technology, together with co-workers in Yokohama, the USA, Italy and the UK, have completed a study using fMRI datasets to train a computer to predict the semantic category of an image originally viewed by five different people
- [1].
- The participants were asked to look at pictures of animals and hand tools together with an auditory or written (orthographic) description. They were asked to silently ‘label’ each pictured object with certain properties, whilst undergoing an fMRI brain scan. The resulting scans were analysed using algorithms that identified patterns relating to the two separate semantic groups (animal or tool). After ‘training’ the algorithms in this way using some of the auditory session data, the computer correctly identified the remaining scans 80-90% of the time. Similar results were obtained with the orthographic session data. A cross-modal approach, namely training the computer using auditory data but testing it using orthographic, reduced performance to 65-75%. Continued research in this area could lead to systems that allow people to speak through a computer simply by thinking about what they want to say.
The contents of the study, background, significance, and future developments
Understanding how the human brain categorizes information through signs and language is a key part of developing computers that can ‘think’ and ‘see’ in the same way as humans. It is only in recent years that the field of semantics has been explored through the analysis of brain scans and brain activity in response to both language-based and visual inputs. Teaching computers to read brain scans and interpret the language encoded in brain activity could have a variety of uses in medical science and artificial intelligence.
Now, Hiroyuki Akama at the Graduate School of Decision Science and Technology, Tokyo Institute of Technology, together with co-workers in Yokohama, the USA, Italy and the UK, have completed a study using fMRI datasets to train a computer to predict the semantic category of an image originally viewed by five different people.
The five participants in the project were shown two sets of forty randomly arranged pictures during the experiment. The pictures came from two distinct categories – either an animal, or a hand tool. In the first session, twenty images of animals and twenty of hand tools were accompanied by the spoken Japanese name of each object (auditory). In the second session - shown to the participants several days later - the same twenty randomly ordered images were accompanied by Japanese written characters (orthography). Each participant was asked to silently ‘label’ each image with properties they associate with that object in their mind.
During each session, the participants were scanned using fMRI technology. This provided Akama and his team with 240 individual scans showing brain activity for each session. The researchers analyzed the brain scans using a technique called multi-voxel pattern analysis (MVPA). This involves using computer algorithms to identify repeating patterns of brain activity across voxels, the cube-shaped elements that make up the 3D scan images. Interestingly, animal pictures tended to induce activity in the visual part of the brain, whereas tool pictures triggered a response more from sensory-motor areas – a phenomenon reported in previous studies.
The MVPA results were then used to find out if the computer could predict whether or not the participants were viewing an animal or hand tool image by looking at the patterns in the scans.
Several different tests were given to the computer. After training the machine to recognise patterns related to ‘animals’ and ‘tools’ in some of the auditory session data for example, the computer correctly identified the remaining auditory data scans as animal or tool 80-90% of the time. The computer found the auditory data easier to predict, although it had a very similar success rate when identifying the orthographic session data.
Akama and his team then decided to try a cross-modal approach, namely training the computer using one session data set but testing it using the other. As perhaps would be expected, the brain scans for auditory and orthographic sessions differed, as people think in different ways when listening and reading. However, the computer suffered an even stronger performance penalty than anticipated, with success rates down to 65-75%. The exact reasons for this are unclear, although the researchers point to a combination of timing differences (the time taken for the participants to respond to written as opposed to auditory information) and spatial differences (the anatomy of the individuals’ brains differing slightly and thereby affecting the voxel distributions).
One future application of experiments such as this could be the development of real-time brain-computer-interfaces. Such devices could allow patients with communication impairments to speak through a computer simply by thinking about what they want to say.
Reference
- 1.
- H.Akama et al. Decoding semantics across fMRI sessions with different stimulus modalities: a practical MVPA study. Frontiers in Neuroinformatics 6 (24) (2012)
doi: 10.3389/fninf.2012.00024
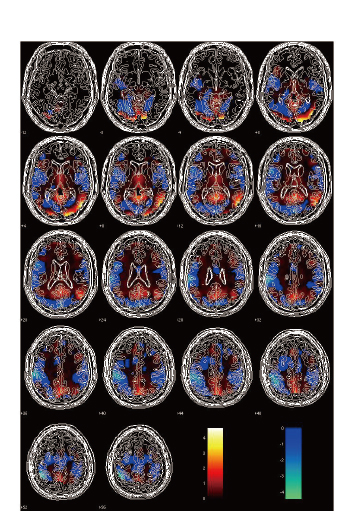
The activation maps of the two contrasts (hot color: mammal > tool ; cool color: tool > mammal) computed from the 10 datasets of our participants.